Following the Business Cycle and Anticipating a New World Order
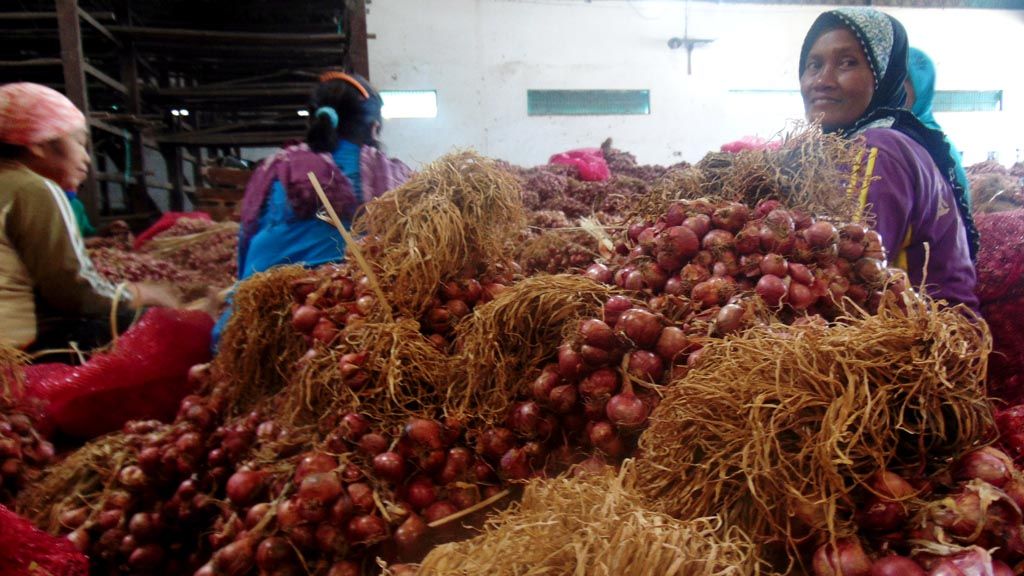
Workers clear red onions to be exported to a number of Southeast Asian nations, Friday (18/8), in Brebes regency, Central Java. Kabupaten Brebes, Jawa Tengah. PT Bawang Merah Indonesia Sejahtera has targeted to export up to 5,600 tons of red onions this year.
It is said that there is no such thing as a never-ending party. Indonesia’s commodity bonanza began around 2004 and ended around 2012 with an average quarterly growth of 5.8 percent (including in 2008-2019, when the global financial crisis emerged).
This phenomenon can be seen from the macro data, such as the average 6 percent quarterly GDP growth (year-on-year) in 2005, compared to an average 4.3 percent growth through 2001-2004.
From the end of 2014 until the third quarter of 2018, the economy battled against the tide. As is common under the Keynesian concept, the government has simply tried to impose a counter-cyclical policy on spending and simplifying regulations in order to maintain the growth momentum. Even though this sounds simple, implementing a counter-cyclical policy is not easy because of several local and external obstacles.
First, the millennial generation (born in the 1980s and 1990s) has started to enter the market as workers or consumers. The millennial generation has a passion for affluent lifestyles that consume high-quality goods and services, including travel, food and other forms of entertainment. If the domestic industry cannot produce goods and services to fit their tastes, this potential will be fulfilled mainly by imports.
The same thing occurs in the consumer goods industry, which relies on imported raw materials, auxiliary materials and intermediate materials despite domestic production. The import structure has not changed much since 2008: about 75 percent of all imports are raw materials, auxiliary goods and intermediate goods; 10 percent consumption goods; and 15 percent capital goods. Thus, the economic stimulus policy has the potential risk of increasing imports, which, if it is not balanced by an increase in exports, runs the risk of causing a trade deficit.
The second obstacle is developments that cause disruptive technology that minimizes human output so that the stimulus policy (pump priming) only has a minimal multiplier effect. Therefore, a separate stimulus policy needs to be designed specifically to create more jobs, for example in rural and urban public service sectors.
The third obstacle involves geopolitical changes and shifting world trade alliances as a result of neo-protectionism, which has escalated the global trade war. This symptom was felt after the emergence of a new US government that has prioritized creating domestic jobs, which was deemed to have declined as a result of unfair trade between the US and its partners. The tactic of negotiating with the threat of tariffs has changed the world trade order and disrupted the existing global supply chain. It has had further impact on capital flows across the world, disrupting emerging economies (markets) with unpredictable results.
Shifting alliances
In the US-China case, failed negotiations have led to a tariff war between the two countries. To reach an agreement, the US threatened to expand the range of China\'s exports to the US that were subject to tariffs. China responded tit-for-tat, drastically reducing US oil and agricultural imports. This disruption in world trade has also shaken the supply chain, leading to threats as well as providing an opportunity to create a new chain anchored in Asia, which might develop into a separate block.
In the case of the US versus Mexico and Canada, the US has offered last-minute concessions that it claims would save the North American trade bloc (NAFTA). With the European Union (EU), it has reached a temporary ceasefire. In the new NAFTA agreement, the US has made concessions: vehicles produced in the US and Mexico must contain at least 75 percent of local US/Mexican components to be free of tariffs. This agreement is a barrier to Asian automotive parts manufacturers from entering the North American market and will shift the supply chain from the Asian motor vehicle industry.
If the vehicles are produced in Mexico, 40-45 percent of spare parts must be imported from the US; if the parts are manufactured in Mexico, the minimum wage must be US$26 per hour. To avoid the risk of being isolated, Canada finally joined the new trade pact at the 11th hour. Canada conceded to opening 3.5 percent of its livestock products market to US producers. The new NAFTA agreement, now called the United States-Mexico-Canada (USMCA) Agreement, has weakened stock prices in Japan, the powerhouse of the world’s automotive industry.
What occurred later was euphoria that the US would again become a manufacturing powerhouse. Stock prices in the US rose sharply, while stock prices and exchange rates in Asia weakened due to portfolio capital flows that fled back to the US. This euphoria quickly ended when the US Fed raised its benchmark interest rates and government bonds rose. Stock market investors became anxious and in a short time, the Dow Jones fell 1,100 points, the sharpest decline in history, although utilities stocks – such as electricity, gas and drinking water – remained high. The mass media responded to this as something “weird with the stock market” in the US. Mass confusion emerged among investors about the direction of investment. The stock market, the goods market and the exchange rate become interrelated as a result of the rise of American neo-protectionism.
Economic performance in pursuing the business cycle
Under these internal and external conditions, the government\'s strategy is to provide stimulus to the domestic economy while enhancing national competitiveness/productivity. Seeing the crises in Argentina and Turkey, the economy cannot be driven beyond its capacity. The strategy of high growth with relatively high inflation, as in 1990s China, cannot be simply applied to other countries because of the different systems of government.
In observing the leading constraint mentioned above, Indonesia has adopted a strategy of steady growth and low inflation from the fourth quarter of 2014 until the third quarter of 2018: measured growth at a not too high average of 5 percent per year, coupled with controlled inflation at below 4 percent per year.
Inflation was 8.36 percent in 2014, which fell sharply to 3.35, 3.02 and 3.61 percent in 2015, 2016 and 2017, respectively. Inflation in 2018 is projected to remain controlled at 3.7 percent until the end of the year, despite pressures from the rupiah depreciation. Quality growth is the main objective of the
growth-inflation path, which can translate into growth by maintaining purchasing power, creating jobs and improving equality.
To achieve this goal, private investment alone is apparently not strong enough to jump-start the economy. The Granger Causality econometric method shows that after 2005, growth in GDP has increasingly led to growth in investment, especially in machinery and equipment, rather than the opposite. Private investment is waiting for business opportunities generated by economic growth than taking the initiative (moving ahead of the curve). This explains why the government is taking the initiative by focusing on providing economic stimulus through infrastructure development, which encourages public demand and also raises national production.
The initial impact of infrastructure development was that it improved the world\'s perception of the general business climate in Indonesia. In 2015-2018, this perception was illustrated in various competitiveness indicators. In 2017, Indonesia’s ease of doing business (EODB) ranking jumped from 106th to the 91st, a 15-ran jump, and Indonesia entered the ranks of the 10 fastest-improving countries (biggest climbers).
In the 2017 competitiveness index, Indonesia rose from the 41st rank to the 36th. The Logistics Performance Index (LPI) survey showed consistent results, with Indonesia successfully climbing 17 ranks to 46th among 160 countries in 2018. One of the causes of this was its increased indicator of timeliness, in which it ranked the 41st in the world. What remains to be done is its customs index, in which Indonesia remains static at 62nd.
The results of all these surveys are very useful as a tool to increase self-confidence to do better. Several successful grand events, such as the 2018 Asian Games and the IMF-World Bank meetings in Bali, also help strengthen perceptions that Indonesia is safe for investment.
Indonesia\'s labor elasticity rate has increased from 0.22 in the final half of the commodity bonanza period (2010-2014) to 0.53 in 2015-2017 through the backbone of infrastructure development, along with labor-intensive village fund programs and inclusive economic development led by state-owned enterprises (SOEs) such as social forestry, village-owned enterprises (BUMDes), tourism-oriented inclusive rural economy projects with financial assistance like the Community Business Credits (KUR). The increased elasticity rate indicates increased labor absorption. In 2015-2017, 1 percent of GDP growth increased employment opportunities by 0.53 percent.
The Gini coefficient also dropped from 0.41 in the final year of the commodity bonanza (2012) to 0.40, 0.391 and 0.389 in 2016, 2017 and 2018, respectively. This decline was partly due to inflation controlled at below 4 percent. In 2018, Statistics Indonesia (BPS) recorded the lowest poverty rate since 1999 at 9.82 percent of the total population.
After 2005-2006, manufacturing was no longer the main driver of growth, and the trade, hotel and restaurant sectors began to share their roles with the manufacturing sector. Later, increasing mobility between cities and villages as a result of better connectivity also connected urban and rural areas in agglomerated job opportunities that allowed residents to improve their welfare.
Social programs like land certification, health cards and smart cards also "formalized" people in the informal sector who had been living outside the purchasing power (circular flow of national income) of the mainstream economy. Developments in the service sectors, especially trade, hotels and restaurants
in medium-sized cities, such as Semarang, Yogyakarta, Palembang, and Manado, helped strengthen this trend.
Responding to shifts in world trade
In view of Indonesia\'s exports, the world before and after the fourth quarter of 2017 is very different. Improvements in real export values began to be seen in the third quarter of 2016 with positive growth after a succession of negative growth from the first quarter of 2015 to the second quarter of 2016. The momentum of recovery in exports continued until the fourth quarter of 2017, precisely until November. As is usually the case, imports also increased following the increased demand for imports and increased domestic economic activities. Nevertheless, a healthy gap still exists between exports and imports, which indicates a trade surplus.
In November 2017, the world market started to hear that Trump would implement his campaign promises to pressure US trade partners such as China and the EU, as well as NAFTA, Mexico and Canada, that were deemed to be employed unfair practices by threatening tariffs (first in steel and aluminum) to obtain concessions. The threat of a trade war caused negative sentiment in the global supply chain, thus reducing Indonesia\'s exports to below imports. The trade balance recorded a deficit and widened the current account deficit to around 3 percent of GDP.
From then on, the rupiah has been under pressure, both because of a decline in the domestic supply of US dollars and because the trade deficit caused pressure to sell foreign-owned Indonesian shares, resulting in portfolio capital outflows. Since August the accumulative trade balance has been in deficit, although March and June saw a surplus. July and August saw a consecutive trade deficit. The source of the July deficit was machinery and mechanical equipment, while August was oil and gas. Postponing several infrastructure projects with high import content is a strategy that the military calls “swapping space for time”. “Traffic controllers” are needed to manage imports such as oil and gas, which the government can control either directly or through SOEs. Queues can be created so that imports are not simultaneous. A trade deficit is often used as a dashboard indicator for short-term capital investors to determine a selling or buying stance. As a result, a surplus returned to September’s trade balance, even though exports fell 6.5 percent from the previous month.
This is the lesson of public policy in which selective restrictions can replace broad restrictions on imports, which have the potential to hamper export-oriented manufacturing industries that need quality import goods. The rupiah depreciation itself served as an automatic stabilizer that halted import growth. An analogy is like treating the flu: knowing when to use paracetamol and when to use antibiotics. It also has to consider the appropriate dosage and length of treatment. Policies that are effective in the short term may not be effective in the long term, so that channels for reviews and feedback will always be needed.
The policy of developing alternative energy sources to replace fossil fuels must continue to be developed for the long term. The US trend shows that sales of Tesla\'s luxury electric cars have exceeded Mercedes and will soon exceed BMW sales. A similar shift will soon spread to Indonesia.
The weakening rupiah since November 2017 reflects the external conditions Indonesia has been facing. In the short term, Bank Indonesia has utilized its interest rates and the foreign exchange reserve to show the market that the central bank was ready to maintain the rupiah’s stability. In both the medium and long term, structural economic improvements are needed. In the service balance in 2017, the balance in
travel and secondary incomes was still positive, around US$4.2 billion and $4.5 billion. The tourism sector can increase foreign tourists from all income groups through price differentiation based on service quality. To increase secondary income remittances, the skills of migrant workers can be improved in the medium term towards formal professions like nurses, cooks and welders.
To increase net foreign revenues from manufacturing, the business climate must be improved, especially for medium-scale producers that make raw materials and intermediate goods for the downstream industry. No less important is attracting medium-scale producers from abroad that make raw and intermediate materials by utilizing overseas Indonesian representatives to provide market information and also incentives to be located in Indonesia. To increase the role of manufacturing in international production and distribution networks, logistics costs must be reduced from 26 percent of production costs to 16 and 13 percent as in Thailand and Malaysia. Trucks from West Java factories to Tanjung Priok, for example, must be able to make the trip twice a day.
The decline in dwell time from 4-6 days in 2016 to an average 3 days in 2018 can still be improved to, for example, 2.9 days. Only the machinery and equipment industry (ISIC 38), which is dominated by the machinery and electrical equipment industry and the automotive and vehicle component industries, has been able to penetrate international distribution channels with respective shares of 5.35 percent and 4.47 percent of total non-oil and gas exports. Out of its share in 2018, these industries ranked third and fourth after mineral fuels and vegetable oils (palm oil).
The perceived risks for long-term investments in Indonesia remain good, as indicated by the relatively stable currency default swap (CDS), which has not shown any significant increase, unlike in 2015 when the rupiah fluctuated. The 19 infrastructure projects that were signed during the IMF-World Bank meetings in Bali provide a foreign investment model that opens up opportunities for the capital account to shift to long-term capital inflows, both in equity and debt securities. In the long run, the capital balance will be less susceptible to capital flow reversals, for example, if capital portfolios become the dominant mechanism for financing the current account deficit. In the long run, the result will be a more stable rupiah. (Ari Kuncoro, Professor and Dean, Economics and Business School, University of Indonesia)